Edit chart
Loading graph
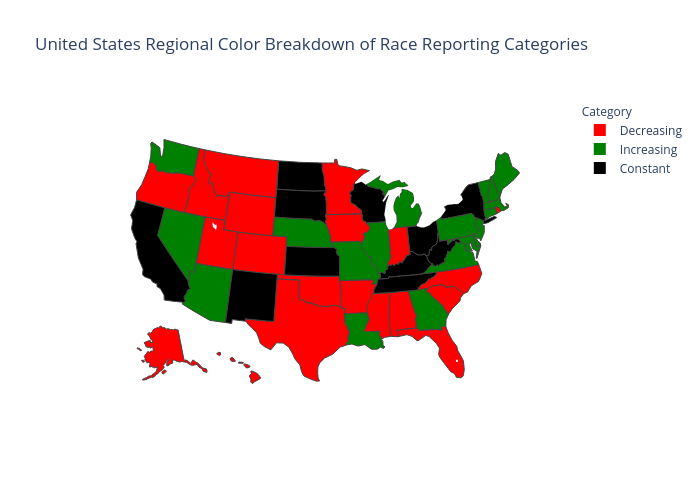
Brianwilliams2022's interactive graph and data of "United States Regional Color Breakdown of Race Reporting Categories" is a choropleth, showing Decreasing, Increasing, Constant. The x-axis shows values from 0 to 0. The y-axis shows values from 0 to 0.